Perspectives: Dimensionning the Housing Crisis
By Laurie S. Goodman
Financial Analysts Journal
June 2010
With the apparent stabilization of home prices and the increase in existinghome sales, many investors believe that the housing market has bottomed and is beginning to recover. I believe that such optimism is premature.
To be sure, there are many positives in the housing market: Prices have fallen significantly, housing is more affordable now than at any time in the past two decades, and the tax credit for first-time homebuyers has helped spur purchasing. Investors, however, are overlooking two critical factors: (1) the size of the “housing overhang” (i.e., the number of loans in delinquency or foreclosure) and (2) the borrowers with negative equity who are likely to default.
Loans continue to move into the delinquency/ foreclosure pipeline at a rapid rate but are moving out at a very slow pace, which creates considerable pressure on the housing market. I estimate the housing overhang to be more than 7 million units—these loans are likely to be liquidated and are creating a huge shadow inventory. Adding borrowers with substantial negative equity but who have not yet become delinquent, I place the total size of the problem at 11 million to 12 million units; in other words, at the current trajectory, more than one in every five borrowers could face foreclosure if stronger policy measures are not taken. Clearly, the biggest problem for these borrowers is negative equity. A successful modification program must address this issue, which means an increased use of principal forgiveness.
Housing Overhang
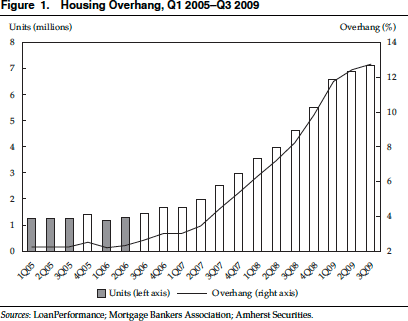
Based on data provided by the Mortgage Bankers Association (MBA), my housing overhang estimate of more than 7 million units that are likely to be liquidated is a huge increase over the 1.27 million units in early 2005. Let us look at the calculations, starting with the latest set of data. The quarterly MBA National Delinquency Survey covers 44.7 million units, or about 80 percent of the total universe. Thus, around 55.9 million homes in the United States have a mortgage. Table 1 shows that at the end of the third quarter (Q3) of 2009, a staggering 14.1 percent of mortgages in the MBA survey were in some stage of delinquency: 4.47 percent of units were in foreclosure, another 4.41 percent were 90+ days delinquent, 1.67 percent were 60 days delinquent, and 3.57 percent were 30 days delinquent.
Let us now look at the private label universe to figure out the probability of recovery (because whatever is not cured must eventually be liquidated). Using quarterly transition rates for our calculations, we can see that Q3 2009 numbers indicate that the cure rate (the likelihood that the loan will not default) is close to 0 percent for loans in foreclosure, 1 percent for loans 90+ days delinquent, 7 percent for loans 60 days delinquent, and 33 percent for loans 30 days delinquent. Thus, we assume that 100 percent of the foreclosure bucket plus 99 percent of the 90+ delinquent bucket plus 93 percent of the 60-day delinquent bucket plus 67 percent of the 30-day delinquent bucket will eventually be liquidated. This assumption implies that of the 14.1 percent delinquent units, we can expect 12.75 percent of them to be liquidated eventually. So, if the MBA data are representative of the mortgage universe, this result suggests that 12.75 percent of 55.9 million units (7.13 million units) are already in the delinquency pipeline and will eventually be liquidated. To put that into perspective, existing-home sales total around 5.4 million units, and so the overhang is about 1.3 � 1 year of existing-home sales.
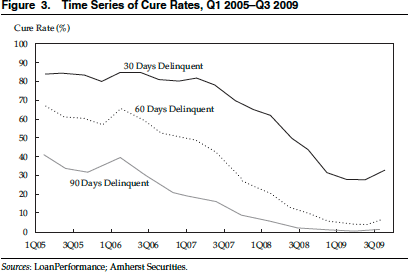
Figure 1 shows both the percentage of overhang and the number of units over time. Note that in Q1 2005, the housing overhang was only 1.27 million units (which was less than 20 percent of Q3 2009 levels). What accounts for the whopping increase? First, only 4.31 percent of units were delinquent in Q1 2005 (2.7 percent were 30 days delinquent, 0.74 percent were 60 days delinquent, 0.87 percent were 90 days delinquent, and 1.08 percent were in foreclosure). Second, cure rates were much higher in Q1 2005: 84 percent for borrowers who were 30 days delinquent, 66 percent for those who were 60 days delinquent, and 41 percent for those who were 90 days delinquent.

Note that the 7.1 million figure encompasses only loans already delinquent; it excludes loans that are current but that will become delinquent. The latter group is currently running around 270,000 a month. In the non-agency market, of the 3.2 million first-lien mortgages classified as “always performing” in the January 2010 remittance report, the First American CoreLogic LoanPerformance Securities Databases show that around 50,000 became 60+ days delinquent for the first time in December 2009. Supplementing this information with the First American CoreLogic LoanPerformance Prime Servicing Database (covering 29 million prime loans) and extrapolating, we can estimate that an additional 220,000 mortgages are becoming delinquent every month.
Can modification plans, as presently constructed, help? I do not think so. The U.S. Treasury Department’s Home Affordable Modification Program (HAMP) is a mortgage modification program with government-paid incentives designed to make mortgage payments affordable. The goal is to reduce the borrower’s payments such that the first mortgage plus taxes plus insurance is less than or equal to 31 percent of the borrower’s income. This goal is achieved by (1) reducing the interest rate (to a minimum of 2 percent), (2) extending the term to 40 years if rate reductions are insufficient to achieve the target debt-to-income ratio, and (3) forbearing principal if the other measures are insufficient to meet the payment target. Note that negative equity is not addressed; even if principal forbearance is performed, the borrower still owes the money. U.S. Treasury numbers indicate that HAMP has lowered borrowers’ payments, on average, by about 31 percent. According to my research, the 12-month recidivism rate on modifications in which payments have been reduced by 30—0 percent (but principal is not written down) has been about 65 percent (i.e., after 12 months, 65 percent of the modifications in which interest rate reductions and term extensions have generated a payment drop of 30—0 percent are at least one payment behind). I believe that a successful modification program must address negative equity, the single most important determinant of default. The Treasury announced such a program in late March, to become effective in the fall of 2010. Although it is an important step, it is optional and should be mandatory.
Let us assume that I am wrong and that the HAMP modifications (with payment reductions) work much better than older-style modifications. Then let us see how much of the overhang of 7 million units can be cured by modification. The answer is, “Not much.” Even if we assume that 85 percent of all mortgages qualify for a modification, only 16 percent of the overhang, or slightly more than 1 million units, would be eliminated. The calculation is as follows: 85 percent of homes are owner occupied, with a loan size under $729,750, as is minimally required to qualify for HAMP. We assume that servicers can reach 50 percent of borrowers and find that they qualify on the basis of income and that the net present value (NPV) of the modification is positive; 50 percent of these borrowers make three payments and submit all documentation necessary for a modification; and 75 percent of these modifications succeed—all of which are very high numbers. Moreover, many of these borrowers would default later if they remained in a negative equity position.
Causes of Housing Overhang
Where is this overhang coming from, and how did it get so big? The short answer is that loans have been transitioning into the delinquency/foreclosure bucket at a rapid rate but have not been liquidating. Let us look at three likely causes: high default transition rates, low cure rates, and longer liquidation timelines.
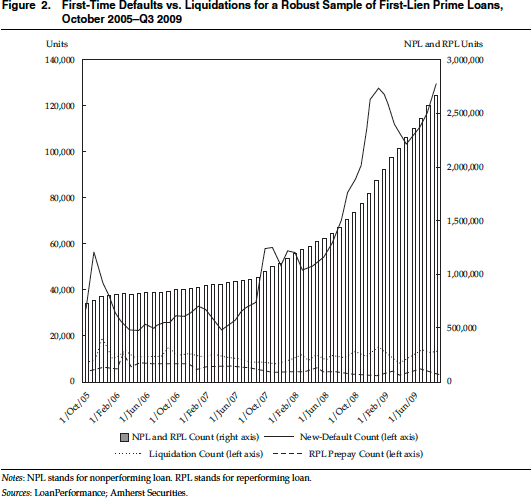
High Default Transition Rates. For ease of discussion, I refer to a loan as defaulted when it is at least 60 days delinquent because such a loan has only a small chance of recovering. Thus, we look at the single-month default transition rate (sTr), the rate at which loans are moving from the performing bucket into the nonperforming bucket. More precisely, we look at the rate at which mortgages are transitioning from the “always performing” bucket (loans that never experienced a 60-day delinquency) into the nonperforming bucket (60+ days delinquent). In contrast, many investors look at liquidations in the remittance reports and use that monthly default rate as a proxy for how quickly the loans are defaulting. The difference is that we measure loans as they move far enough into the delinquency/foreclosure pipeline that they have very little chance of recovery. Many investors are capturing what is emerging from the pipeline (i.e., liquidation). With loans taking longer to liquidate, many investors are essentially looking at what went into the delinquency/ foreclosure pipeline 18-24 months ago and missing much more current information.
For the non-agency securitized universe as a whole, the December 2009 defaults of $14.9 billion are only slightly higher than the $12.9 billion of liquidations. These numbers, however, mask very different behaviors in different sectors of the nonagency securities market. For subprime mortgages, liquidations outnumber new defaults. Transition rates on these securities began to ramp up in 2007 and early 2008, and these loans are now being liquidated. New defaults (loans 60 days delinquent for the first time as a percentage of the “always performing” bucket) are being calculated from a smaller pool of loans because only 32 percent of the current subprime balance is “always performing” (51 percent is nonperforming; 17 percent is reperforming). For Alt-A mortgages (in which the combination of risk factors means the reasonably high-quality borrowers do not qualify for prime loans) and payment-option adjustable-rate mortgages, new defaults and liquidations are very close. In contrast, for prime non-agency securities, new defaults are much higher than liquidations. New defaults have ramped up relatively recently, and liquidations lag.
The private label universe, on which we have excellent data, is only $1.6 trillion (14.5 percent) of the $11 trillion U.S. mortgage market. And most of that $1.6 trillion is very adversely selected collateral and is not representative of the mortgage universe as a whole, as evidenced by the fact that 28 percent of the private label universe is nonperforming. The $9.4 trillion ($11.0 trillion — $1.6 trillion) of U.S. mortgages not in private label securitizations consists of $5.2 trillion in agency securities (Ginnie Mae, Fannie Mae, Freddie Mac), $3.3 trillion in first liens held in bank portfolios in nonsecuritized form, and $1 trillion in second liens or home equity lines of credit held in bank portfolios in nonsecuritized form. The GSE (government-sponsored enterprise) loans and the first liens held in bank portfolios are considered high quality and would be expected to behave much more like the prime sector of the non-agency securitized universe than like subprime or Alt-A mortgages. That is, for this vast majority of mortgages (the bulk of the U.S. mortgage universe), new defaults are far higher than liquidations.
To verify this observation, we turn to the First American CoreLogic LoanPerformance Prime Servicing Database, which contains data on 29 million prime loans contributed by 12 servicers (29 million loans is slightly more than 50 percent of the roughly 56 million mortgages outstanding). We strip out loans in private label securitizations and assume that the remainder is representative of the universe of GSE and bank portfolio loans. For this pool of loans, new defaults are much higher than liquidations. For this dataset, Figure 2 shows that as of the end of Q3 2009, the new-default loan count totals 120,000 units a month, whereas the liquidation loan count is a fraction of that—13,000 units a month. (To replicate the universe of GSE and bank portfolio loans, this number can be multiplied by 1.85, which gives us 220,000 new defaults and 24,000 liquidations.) Figure 2 also shows that the nonperforming and reperforming buckets are growing rapidly. Clearly, for agency securities and loans in bank portfolios, new defaults are much higher than liquidations because defaults are building rapidly and liquidations lag.
Low Cure Rates. A key driver of the housing overhang is the very low cure rates on delinquent loans. Figure 3 shows the time series of cure rates (based on data from the non-agency mortgage market). (Note that Figure 1 was produced by using this time series of cure rates.) The cure rate data were calculated by repeated applications of the transition matrices for each quarter. Note that the cure rate for loans that are 60+ days delinquent decreased from 66 percent in early 2005 to 7 percent in Q3 2009.
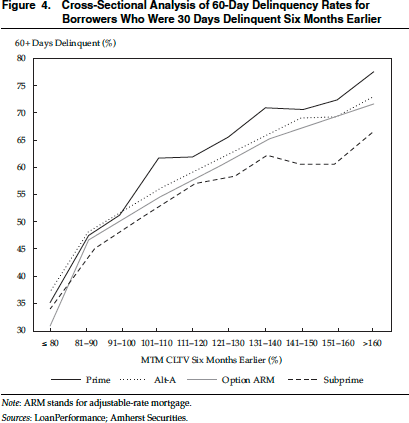
The cure rates are so low because it is not in the borrowers’ best economic interests to cure mortgages with significant negative equity. Once borrowers become delinquent for any reason, they must struggle to become current. Thus, becoming delinquent can trigger a re-evaluation of financial circumstances. At that point, curing becomes an economic decision, and a borrower with substantial negative equity is less apt to be cured. Figure 4 depicts a cross-sectional analysis by tracing the behavior of borrowers who were 30 days delinquent six months earlier. Note that only 35 percent of prime borrowers with less than an 80 percent combined loan-to-value ratio (CLTV) six months earlier are now 60+ days delinquent, but that number rises to almost 80 percent of prime borrowers with high CLTVs. In fact, as can be seen from Figure 4, prime borrowers are the most ruthless defaulters.
Longer Liquidation Timelines. Liquidation timelines have unquestionably been dramatically extended. Figure 5 shows the elapsed time between last payment and liquidation for loans in non-agency securitized pools liquidated from 2007 to 2009. The entire distribution has shifted to the right, indicating that 2009 loans have spent longer in the delinquency/foreclosure pipeline than did loans liquidated during 2007 or 2008. And this analysis has a selection bias in that we are measuring only loans that are actually liquidated. Loans that are harder to liquidate stay in the pipeline even longer. Of loans in the pipeline in late 2009, 9 percent have not had a payment made in more than 24 months, whereas in late 2008, the comparable level was 4 percent.
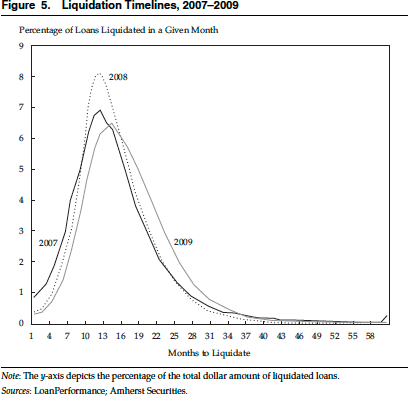
The reasons for the longer liquidation timelines are numerous, and each tacks on additional time: foreclosure moratoriums (federal and state), longer minimum waiting periods before the notice of default and between the notice of default and the trustee sale, and new rules by the Treasury Department requiring that each loan be tested to see whether the borrower can qualify for a modification. Moreover, the judicial process has slowed in judicial states (i.e., those in which court approval is required to foreclose).
Putting It All Together
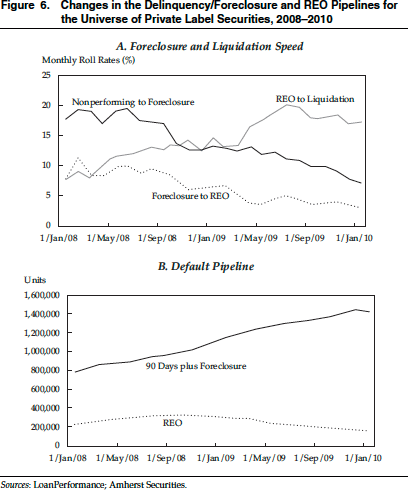
Figure 6 is a useful summary of the universe of private label securities. Panel A shows that the roll rates from nonperforming status to foreclosure and from foreclosure to real estate owned (REO) have decreased. The roll rate from REO to liquidation, however, has risen, indicating that once a loan hits REO, it liquidates fairly rapidly. This result is shown in Panel B—a sharp drop in the amount of REO on the market but a far more dramatic rise in the 90+ delinquency plus foreclosure bucket. From October 2008 until January 2009, the REO bucket decreased from 324,494 to 167,600 units. Meanwhile, over the same period, the 90+ delinquency plus foreclosure bucket leapt from 1,004,219 to 1,424,739 units. Thus, the serious delinquency plus foreclosure bucket has increased far more than the REO bucket has decreased. Part of the stabilization of home prices reflects the fact that the share of distressed sales was 33 percent in November 2009, down from 50 percent in March 2009.
We have now established that the housing overhang is a very significant problem. But the problem does not end there. A huge number of borrowers are underwater but continue to pay their mortgages. Those borrowers, however, are moving into the nonperforming state very quickly.
Negative Equity. Table 2 quantifies the negative equity problem. The top section (labeled Non- PLS, or non—private label securities) shows the data for the universe of 49 million GSE and bank portfolio loans. (These data were taken from the First American CoreLogic LoanPerformance Prime Servicing Database and were grossed up to mirror the universe of mortgages that is not included in private label securities.) The middle section of Table 2 contains data on the universe of 5.8 million private label securities, or PLS (taken from the First American CoreLogic LoanPerformance Securities Databases). In the table’s bottom section, I added together the first two groups of loans. For each of the three groups (NonPLS, PLS, and total), I first separated out nonperforming mortgages (defined as loans 60+ days delinquent) and reperforming mortgages (loans that were 60+ days delinquent but are now current or one payment behind). In the universe of “always performing” loans (those never more than two payments behind), I marked the loans to market by using the S&P/Case—Shiller Indices. I used the most granular information available on each loan. That is, when I had information on home prices at the zip code level, I defaulted to that; if that information was unavailable, I used metropolitan statistical area (MSA) data. If those data were unavailable, I defaulted to state level information. If that was unavailable, I used the U.S. Office of Federal Housing Enterprise Oversight House Price Index at the state level. After marking to market, I then sorted these always-performing loans (APLs) into three categories: APLs with mark-to-market (MTM) LTVs (loan-to-value ratios) greater than 120 percent, MTM LTVs of 100—120 percent, and MTM LTVs of less than 100 percent.
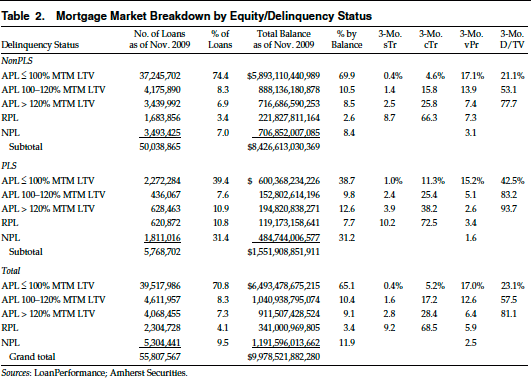
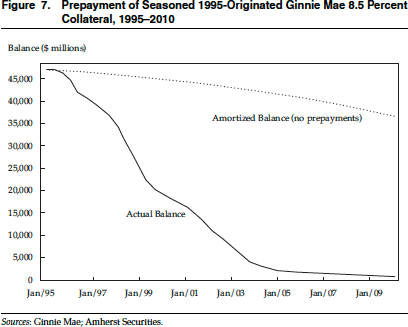
Table 2 shows that for the universe as a whole, 5.3 million units are nonperforming (NPL) and another 2.3 million units are reperforming (RPL). (Recall from Table 1 that once a loan is 60 days delinquent, it has only a 7 percent cure rate, and for loans that are 90 days delinquent, cure rates have been running under 2 percent.) The reperforming mortgages are redefaulting at a rate of 9.2 percent a month (fourth column from the right [labeled sTr, for single-month transition rate]), or 68.5 percent a year (third column from the right [labeled cTr, for constant transition rate]). Absent a more successful modification program, most of the mortgages in these buckets will eventually be liquidated.
Now let us look at the 4.07 million units of APLs with MTM LTVs greater than 120 percent. Note that we are using MTM LTVs rather than MTM CLTVs (combined loan-to-value ratios) because we cannot get CLTV information for the universe of GSE and bank portfolio loans; thus, we are understating the negative equity positions of many of these borrowers. The APLs with MTM LTVs greater than 120 percent are becoming 60+ days delinquent for the first time at 2.8 percent a month, or 28.4 percent a year (fourth and third columns from the right). These loans are prepaying at 6.4 percent a year (second column from the right [labeled vPr, for voluntary prepayment rate]).
Both the constant transition rates and the default rates are closely related to home equity; borrowers with negative equity default much more frequently and prepay much less frequently than do their positive equity counterparts. We have seen APLs with MTM LTVs greater than 120 percent defaulting at 28.4 percent a year. In contrast, APLs with MTM LTVs of 100-120 percent are defaulting at 17.2 percent a year, and APLs with MTM LTVs under 100 percent are defaulting at 5.3 percent a year. Meanwhile, voluntary speeds are 6.4 percent for APLs with MTM LTVs greater than 120 percent, 12.6 percent for APLs with MTM LTVs of 100-120 percent, and 17.0 percent for APLs with MTM LTVs under 100 percent.
Very few mortgages are paid on schedule all the way to maturity; most are voluntarily prepaid or go into default. As shown in Figure 7, which depicts the fate of the Ginnie Mae security issued in 1995 with a net coupon of 8.5 percent (the borrower paid a 9 percent interest rate, and an 8.5 percent coupon was passed through to the Ginnie Mae investor), absent any prepayments or defaults, the $46.9 billion in initial mortgage balances would have amortized down to $36.5 billion. But in point of fact, the balance was $653 million. Thus, after 15 years, only 1.4 percent of the original balances were outstanding.
This observation is relevant because a mortgage will either be prepaid or go into default, which allows us to use current ratios to figure out the percentage of a cohort expected to default if nothing changes. As we can see in Table 2, in the case of our 4.1 million APLs with MTM LTVs greater than 120 percent, 81.1 percent will default. The D/TV, or defaults/total value, is the ratio of defaults to defaults plus voluntary prepayments; in this case, 28.4/(28.4 + 6.4) = 81.1 percent. The 4.6 million APLs with MTM LTVs of 100-120 percent are becoming delinquent for the first time at a rate of 17.2 percent a year (cTr), with voluntary prepayments at 12.6 percent a year. Thus, the likelihood of eventual default, D/TV, is 17.2/(17.2 + 12.6) = 57.5 percent. And even the 39.5 million APLs with positive equity are moving toward default (cTr) at 5.2 percent a year and being voluntarily prepaid at 17.0 percent a year. So, the D/TV for these loans is 23.1 percent. (The transition rate for the positive equity loans may appear high because we are looking at LTV, not CLTV. The likelihood is that many of these loans have second mortgages, and so they do, in fact, have negative equity.)
Let us add it all up in order to dimension the housing problem. If we assume that all nonperforming loans default and that these D/TV ratios continue indefinitely (a highly unlikely assumption), 22.5 million units will eventually be liquidated. This conclusion is excessively harsh. I believe that as home prices stabilize, these ratios will return to normal levels over time, and thus actual liquidations will be much lower. Moreover, although home prices are likely to fall somewhat further in the near term, at some point they will begin to improve. A more reasonable set of assumptions is that all the nonperforming loans will need resolution, as will 90 percent of the reperforming loans, 75 percent of the APLs with MTM LTVs greater than 120 percent, 25 percent of the APLs with MTM LTVs of 100-120 percent, and 0 percent of the APLs with equity. This set of assumptions suggests that 11.57 million units will eventually be foreclosed.
Policy Implications. Although home prices appear to have stabilized temporarily and housing affordability has been restored, the housing market has some deep problems. The first problem facing the mortgage market is the shadow inventory, or housing overhang, of 7 million units. Nationwide, this number represents a considerably larger volume than one year of existing-home sales (5.4 million units). In addition, 270,000 new units a month are moving into the nonperforming bucket (50,000 from the private label universe and 220,000 from the rest of the market); these loans have a low chance of being recovered.
The second problem is borrowers with negative equity. If nothing is done by policymakers to mitigate the problem, a huge percentage of those borrowers will default and their loans will be liquidated. I expect that in addition to the 7 million units of shadow inventory from already delinquent borrowers, an additional 4 million to 5 million borrowers with negative equity will also default. And to the extent that more home price depreciation is occurring (causing higher default volumes), the number of defaults could escalate.
Thus, we have a housing problem that affects 11 million to 12 million units. If nothing is done, more than one homeowner out of every five will face eviction. Politically, this scenario is unacceptable (homeowners are voters) and, therefore, is unlikely to unfold. Moreover, government officials are concerned about the consequences of placing a large number of additional homes on the market, thus generating a “death spiral” of lower prices, which would result in more borrowers with negative equity; these borrowers would be more likely to default, go into foreclosure, and be added to the housing supply, which, in turn, would force prices still lower. To put the problem in perspective, since December 2006, 1.5 million units have been liquidated, which has put enormous pressure on housing prices. And we are talking about liquidating 11 million to 12 million units—think of what such an action would likely do to housing prices.
Indeed, I think the scenario that is most likely to unfold is that the government will embark on one modification program after another in order to prevent mass displacement. As I have already noted, so far, such efforts have simply postponed the problem and been largely unsuccessful.
No “silver bullet,” no single solution will solve the problem. I believe that the housing market intervention must take the form of the following two measures:
- Reduce the potential supply of homes on the market. The reduction of potential supply can best be accomplished by a program that encourages sustainable modifications through complete documentation, consideration of the borrower’s total financial circumstances, and the explicit acknowledgment that negative equity matters. Such a program will keep more borrowers in their homes and thus reduce the potential supply.
- Increase the demand for viable mortgages. The demand must be sufficient to absorb those homes that borrowers simply cannot afford.
Sustainable Modifications
To create a program that encourages sustainable modifications, three conditions must be in place:
- The modified loans must be re-underwritten to verify income and assets. Ideally, the reunderwriting should be performed by originators, who know how to collect documentation, rather than by servicers. At this point, however, servicers—over the past year, while the housing crisis has escalated—have built an infrastructure that can handle documentation. Starting on 1 June 2010, the Treasury will require that documentation be provided for HAMP modifications before the modifications can proceed. This huge step forward will help ensure that the modifications are, in fact, sustainable. The originator/servicer should collect more information on assets and other debt obligations and have more flexibility in making modification offers. The Treasury is already paying servicers for handling the documentation, a practice that should continue.
- The borrower’s total financial obligations, not just the first mortgage, must be considered in making the modification offer. Under HAMP, the borrowers who have converted to a permanent modification program have had their front-end debt-to-income ratio (DTI) fall from 45 percent to 31 percent. The back-end DTI, however, has fallen from an incredible 76.1 percent to a still unsustainable 59.7 percent. This aspect should be part of the re-underwriting. Moreover, second liens are a major contributor to the high back-end DTIs; the second-lien modification program, as currently proposed, is likely to be largely ineffective.
- Negative equity must be explicitly acknowledged as a significant driver of defaults. We know that payment reductions alone are insufficient, as evidenced by the low percentage of borrowers who have been able to turn their HAMP trial modifications into permanent modifications. The average borrower who enters a HAMP modification has an LTV of 134.1 percent before modification and a ratio of 136.6 percent after modification as the recoveries of principal and interest advances are capitalized into the amount owed on the home. The only way to deal with negative equity is to forgive principal. In fact, the Treasury has proposed, starting sometime in the fall of 2010, that servicers should look at the NPV of a modification by using both the current waterfall (reduce the interest rate, extend the term, and forbear principal) and an alternative waterfall (forgive principal to an LTV of 115 percent, reduce the interest rate, extend the term, and forbear principal). Unfortunately, the principal reduction waterfall is voluntary for servicers and no effective plan exists for dealing with second liens. Forgiving principal on the first lien when the second lien is not written down would be a complete perversion of lien priorities. I would expect that before the principal reduction waterfall is implemented, a more effective way to deal with second liens will be in place.
I believe that the government should not pay for the principal forgiveness; the costs should be borne primarily by the investors because the modification would improve the loan’s NPV to the investors. Without a successful modification, the loan is likely to be liquidated. And if the loan is liquidated, foreclosure, with its attendant high costs, will be the result—and a foreclosed home sells at a discount.
Although many may feel that allowing for a large-scale abrogation of debt is morally reprehensible and creates a huge moral hazard, the alternatives are worse. In addition to the acceleration of the “death spiral” (more price declines means more negative equity means more defaults), there is a deadweight foreclosure loss of approximately 30 percent. This loss includes the foreclosure discount on the house, as well as the costs associated with removing the borrower and remarketing the house. Rather than thinking of “intentional default” as a moral hazard, we need to recast it as an economic decision. Doing so would allow us to address the issue in an unemotional fashion.
Consider three borrowers, each of whom has a $300,000 mortgage on a home now worth $250,000:
- Borrower 1 can afford to pay a $300,000 mortgage.
- Borrower 2 can afford to pay a $250,000 mortgage.
- Borrower 3 can afford to pay a $100,000 mortgage.
Ideally, we want Borrower 1 to continue to pay her mortgage, Borrower 2 to stay in his home, and Borrower 3 removed from her home. Logically, because Borrower 2 can afford to live in his home, the goal should be to find some way to leave him there and avoid the deadweight costs of foreclosure. That must be done in such a way that Borrower 1 continues to pay her mortgage without wanting the same deal as her neighbor, Borrower 2. Borrower 3 can afford to live in only a $100,000 home; under no sensible set of arrangements would it make sense to maintain Borrower 3 in her current home. How do we achieve these results?
Borrowers who receive reductions in principal need to be requalified (i.e., re-underwritten with full documentation to substantiate income and assets) to ensure that they can afford their homes at the current market value. This requalification must look at borrowers’ entire financial obligations. Borrower 3 will not qualify. The HAMP modification addresses Borrower 3 by requiring the servicer to run an NPV test and to show that the NPV of a modified loan is higher than that of a liquidated one.
We need to design a series of incentives that keep Borrower 2 in his home and that maximize the likelihood that Borrower 1 will continue to pay. Clearly, we must devise some frictions that make default so costly that most borrowers who can pay will choose to do so. These frictions could include some combination of the following: (1) a shared appreciation mortgage (or, equivalently, a high tax rate on the appreciation from mortgages that have received a principal reduction), (2) a wellexplained set of consequences of a borrower’s credit rating, (3) a ban on adding a second mortgage to the property, and (4) full recourse on the new mortgage. These frictions need to be well understood by Borrower 2 before he agrees to the principal reduction. Borrower 1 is likely to stay in her home (she will not want to incur the frictions) when her LTV is 120 percent ($300,000/$250,000)—that is, the cost she places on the frictions is likely to be greater than 20 percent. If her LTV is 150 percent, she is very likely to default intentionally, with or without a principal reduction program in place. Again, the decision to default must be viewed as an economic, not a “moral,” one. And frictions must be introduced to produce the desired behavior. Although the newly announced principal reduction program does include consequences for the borrower’s credit rating, it does not include any of the other proposed frictions.
Moreover, the success of the modification program will be maximized if the borrower is able to earn the principal reduction by making payments on the new loan amount on schedule for a period of time (e.g., the principal will be permanently forgiven if the borrower makes three years of payments on time). In fact, this incentive is a feature of the newly announced principal reduction waterfall in HAMP.
Let us assume that a successful modification plan will allow us to save 6 million of the 11 million to 12 million units that are likely to be liquidated if no further action were taken. If we further assume that the average loan balance is $240,000 and the deadweight costs of foreclosure are 30 percent, or $80,000 per loan, the direct savings would be $480 billion. And that amount is in addition to the benefit obtained from reducing pressure on the home price spiral.
Many borrowers, like Borrower 3, are unable to afford their homes at the new market value. Short sales, deeds-in-lieu, and other actions whereby a borrower is incentivized to maintain the home while it is on the market (or at least not diminish its value by destroying the home) are desirable. And HAMP has produced a series of incentives to encourage such actions.
Increasing the Demand for Housing
Removing the borrower from the home is only half the problem. With more of these homes hitting the market over the next few years, who will be there to absorb them without major additional home price declines? Because investors have already purchased a disproportionate number of foreclosed properties, prudent expansion of the availability of credit to this set of potential buyers would be the single most important demand-side action that could be taken. I urge the creation of a U.S. Federal Housing Administration (FHA) program for investors that would require a 15—20 percent down payment and provide financing for the balance. (FHA loans are now offered only for owner-occupied properties.)
One thing is clear: A range of programs that focus on increasing the demand for housing is needed. This issue has not received adequate attention.

